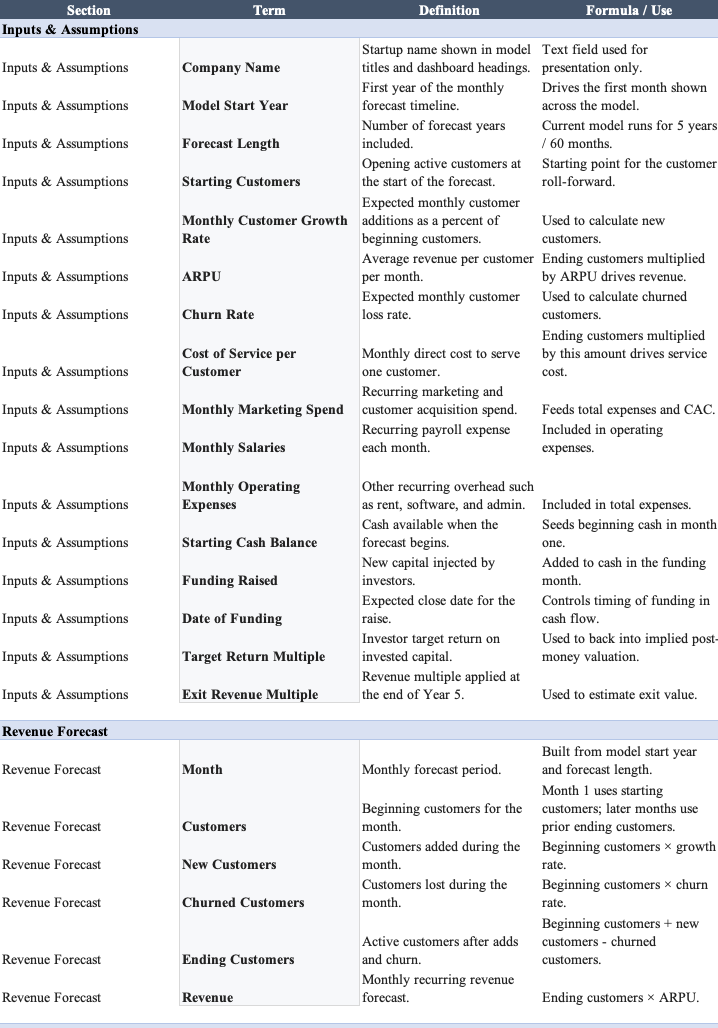
Fill in the Inputs and Assumptions tab with company name, growth rate, ARPU, churn, costs, and funding date, and all 8 downstream sheets update automatically. Revenue, expenses, income statement, cash flow, runway, valuation, and KPI dashboard all link to that single source.
- Single entry point: one tab controls the entire model
- 60-month forecast across revenue, expenses, and cash flow
- Runway analysis with break-even month and burn rate
- Valuation model and live KPI dashboard included
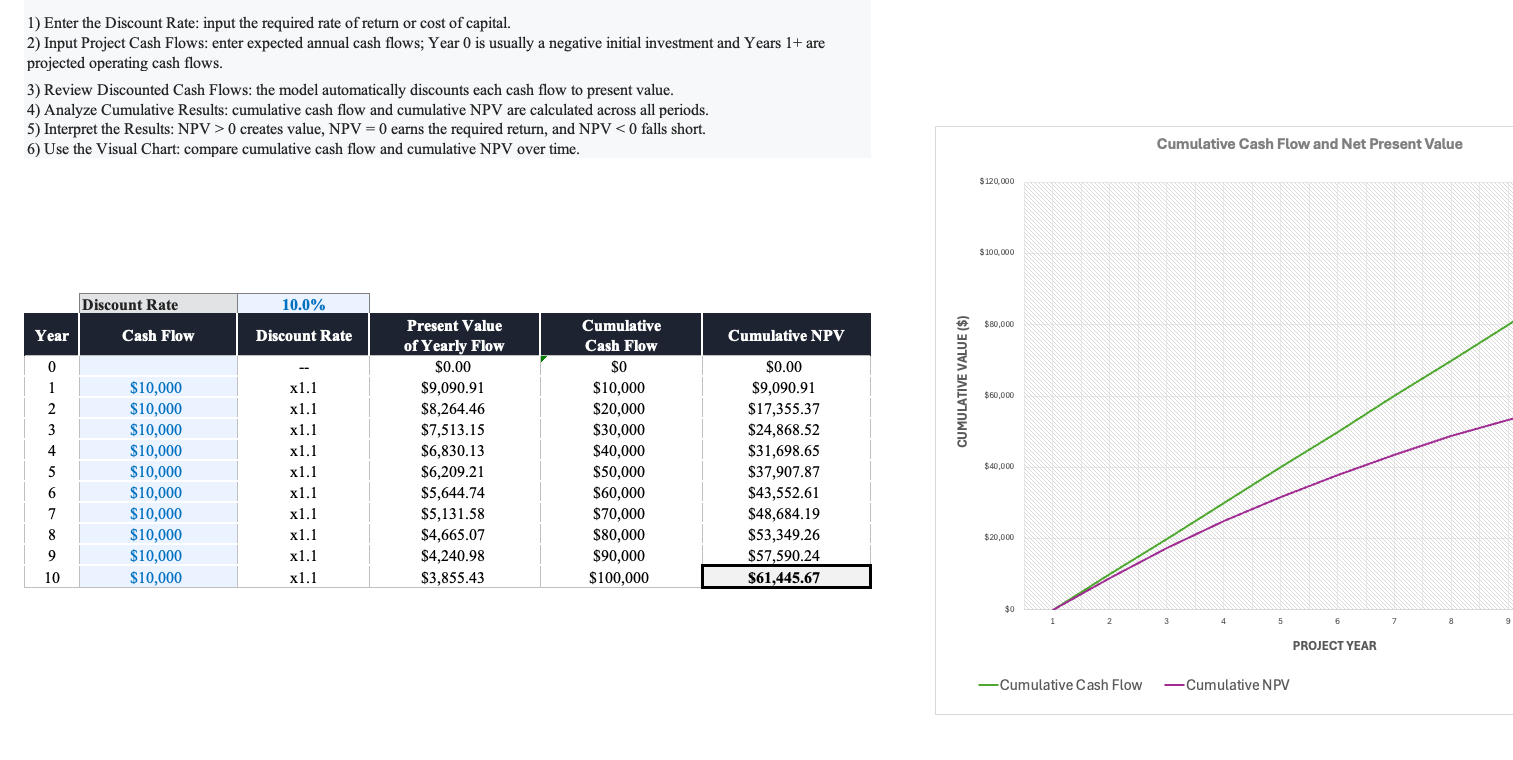
Enter a single discount rate and up to 10 years of cash flows. The model automatically discounts each period, tracks cumulative cash flow, and calculates a running NPV, all from one input cell.
- Single discount rate drives all 10 periods automatically
- Cumulative cash flow and cumulative NPV columns
- Present value calculated per year via POWER formula
- Replace example cash flows with your own values
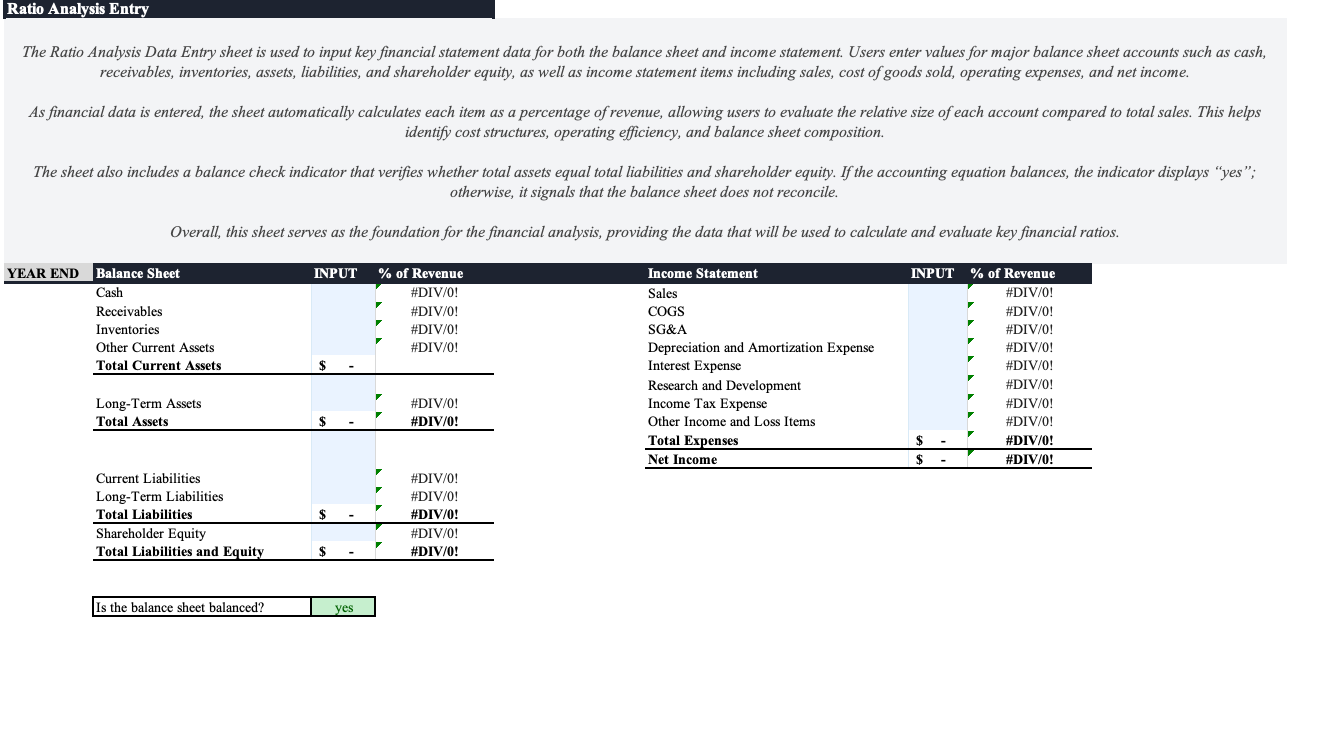
Enter balance sheet and income statement figures on the data entry tab. The results tab pulls automatically and calculates all ratios. No manual formulas needed.
- Separate data entry and results tabs
- Asset turnover, ROA, ROE, and leverage ratios
- Current ratio, quick ratio, and asset-to-liability ratio
- Percentage-of-revenue column auto-calculates alongside inputs
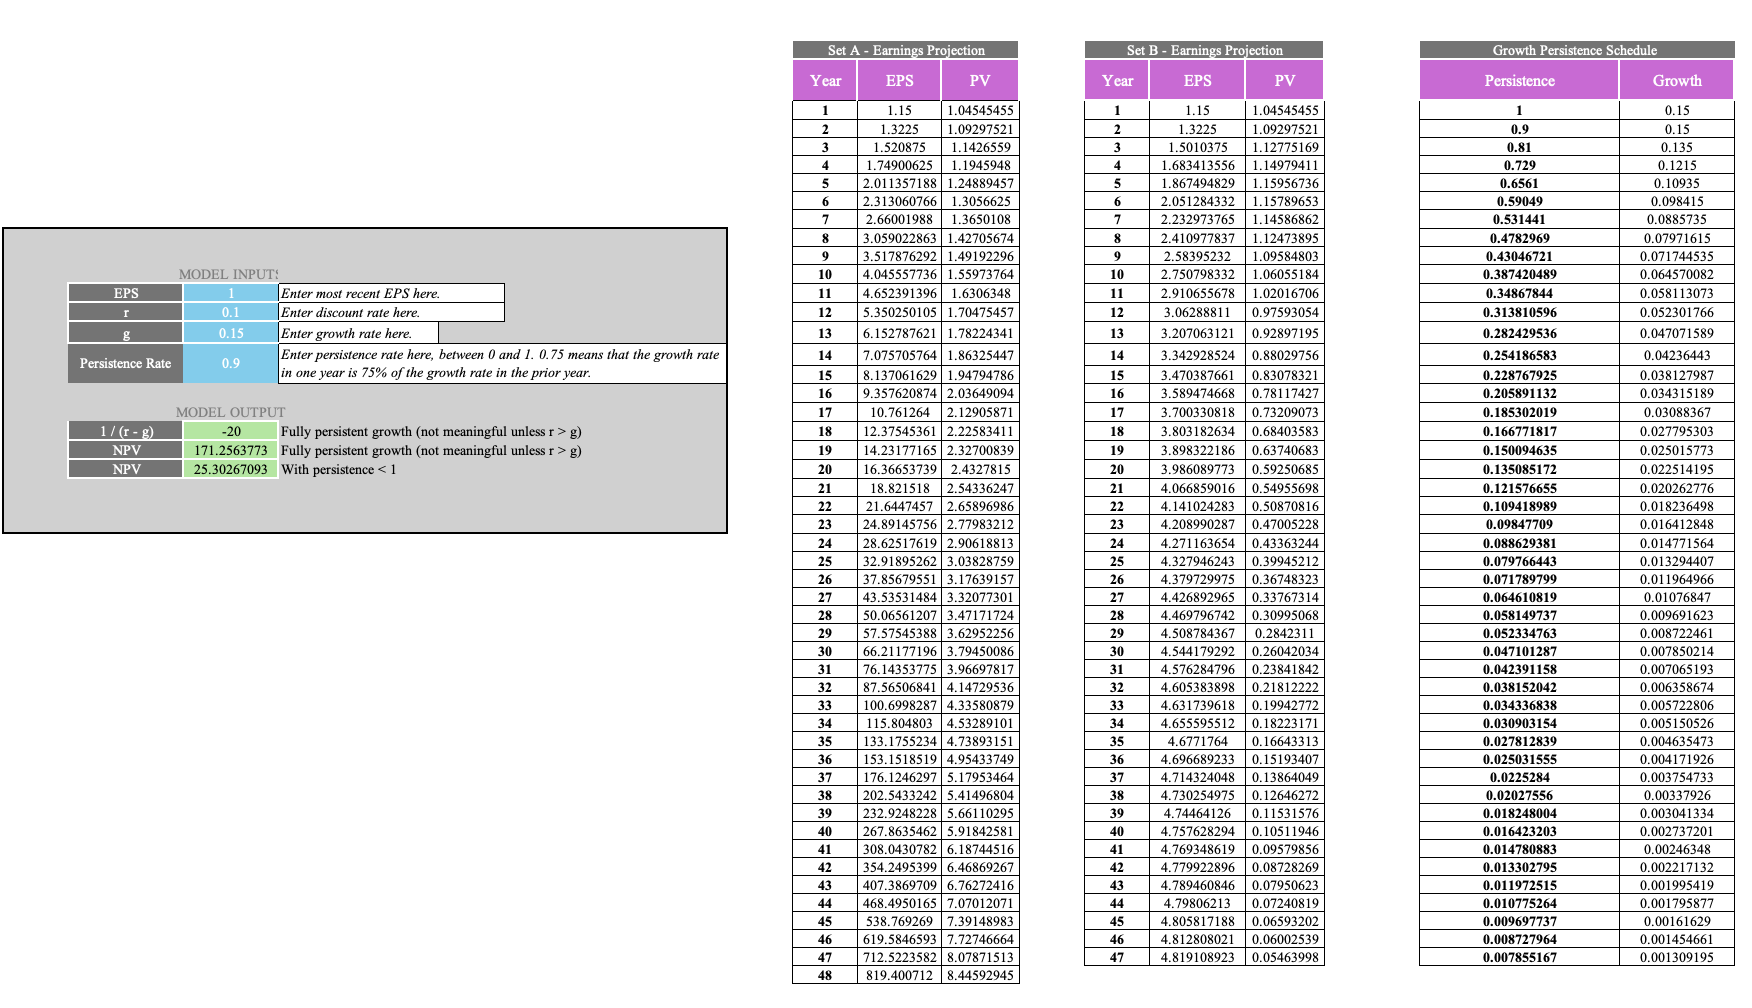
Input EPS, a discount rate, a growth rate, and a persistence rate. The model runs two parallel 48-period projections, one with constant growth and one where growth decays over time, and outputs an NPV for each.
- Set A: constant growth projection across 48 periods
- Set B: growth that decays based on a persistence rate you set
- NPV calculated for both scenarios side by side
- Persistence schedule shows exactly how growth fades each year
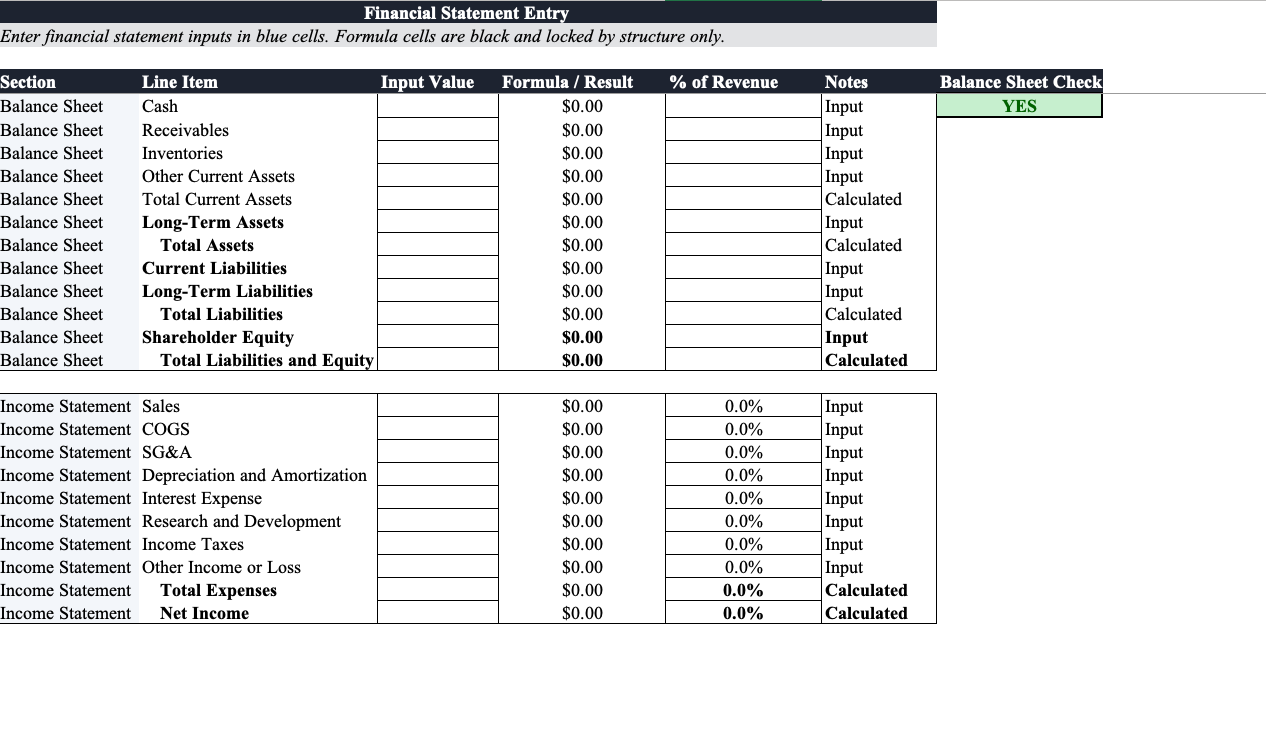
A guided three-tab workbook. Enter one period of financial statement data into the blue input cells, verify the balance sheet check reads YES, then review all calculated ratios on the results tab. No formulas to write.
- Workbook guide tab walks through every step
- Blue input cells clearly separated from locked formula cells
- Live balance sheet check confirms assets equal liabilities and equity
- Results tab covers profitability, leverage, liquidity, and solvency
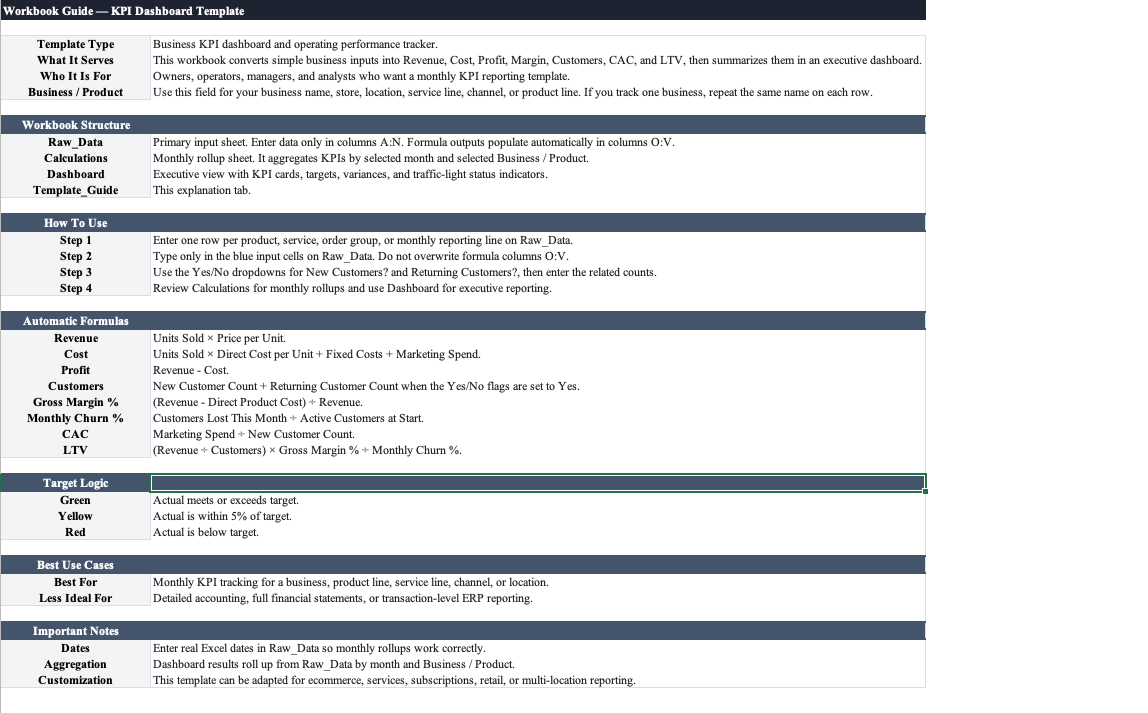
A dynamic KPI dashboard built for executive decision-making, with automated data aggregation, variance analysis, and rule-based performance indicators. Conditional logic flags underperformance, highlights trends, and standardizes reporting across business units — minimal manual input, maximum visibility.
- Automated revenue, cost, profit, and margin calculations from one input tab
- Traffic-light status indicators flag performance against targets
- Monthly rollup view with CAC, LTV, and churn metrics
- Dashboard updates dynamically by business unit and reporting period
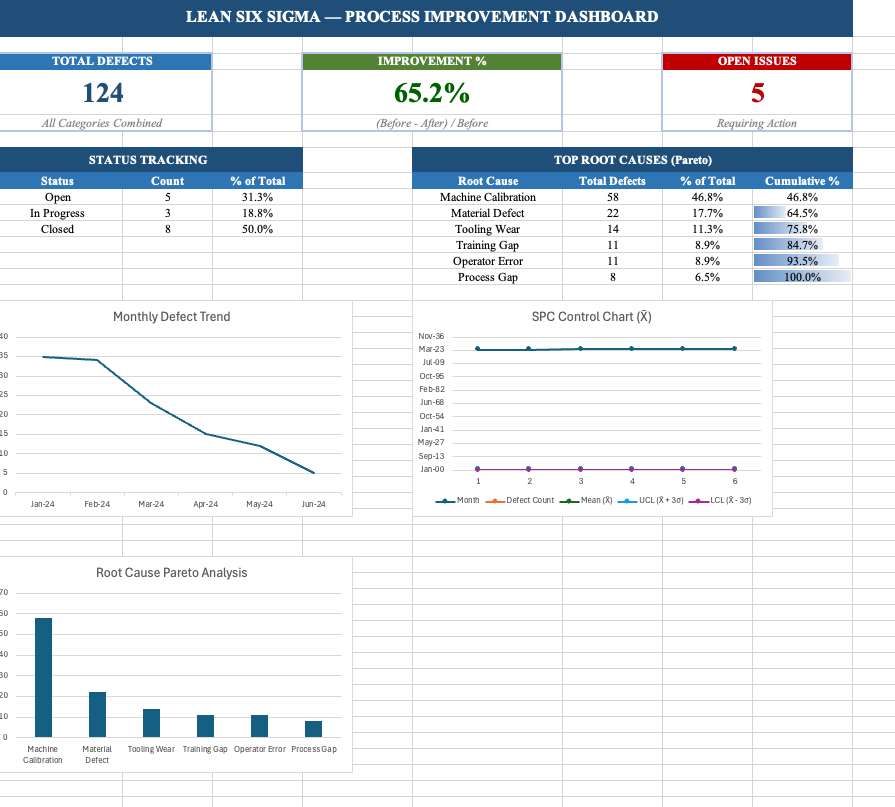
A process improvement tracking tool grounded in Lean Six Sigma principles, designed to monitor defects, root causes, and operational performance over time. Rule-based alerts, automated calculations, and conditional formatting identify inefficiencies, measure improvement impact, and enforce structured issue resolution.
- Defect tracking with Pareto root cause analysis built in
- SPC control chart (X̄) with UCL and LCL auto-calculated
- Monthly defect trend and improvement percentage dashboard
- Status tracking for open, in-progress, and closed issues
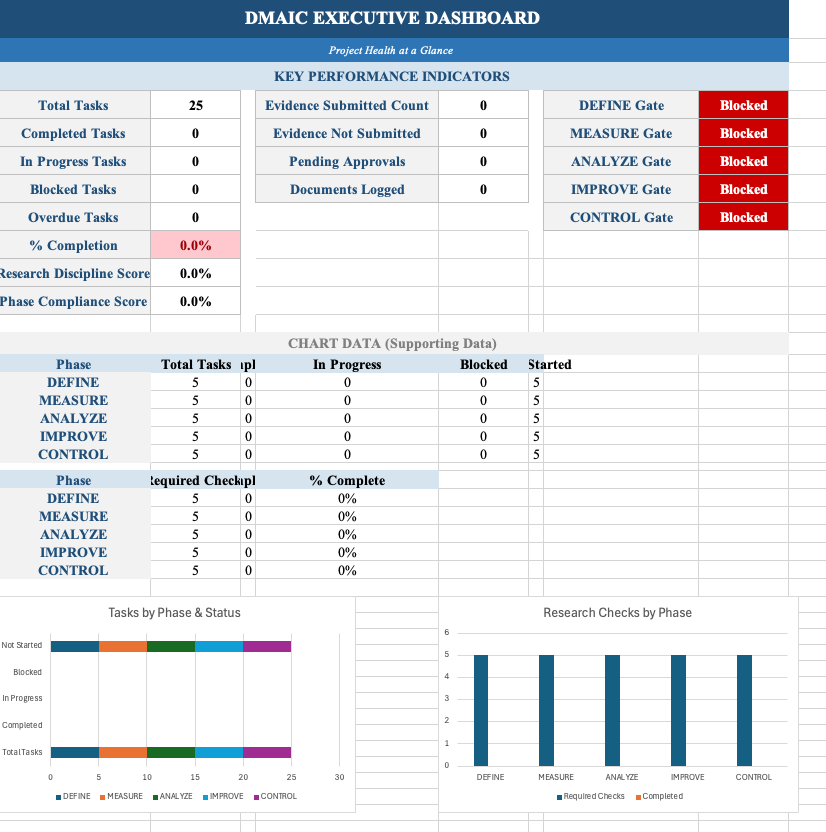
A DMAIC-based process governance system combining a visual roadmap with rule-based controls to enforce disciplined execution across each improvement phase. Automated phase-gate logic, research validation checkpoints, and evidence tracking ensure projects cannot advance without proper data, analysis, and sign-off.
- Phase-gate logic blocks progression until checkpoints are met
- Evidence tracking and research discipline scoring per phase
- Executive dashboard with completion %, gate status, and task counts
- Standardizes problem-solving and accountability across teams
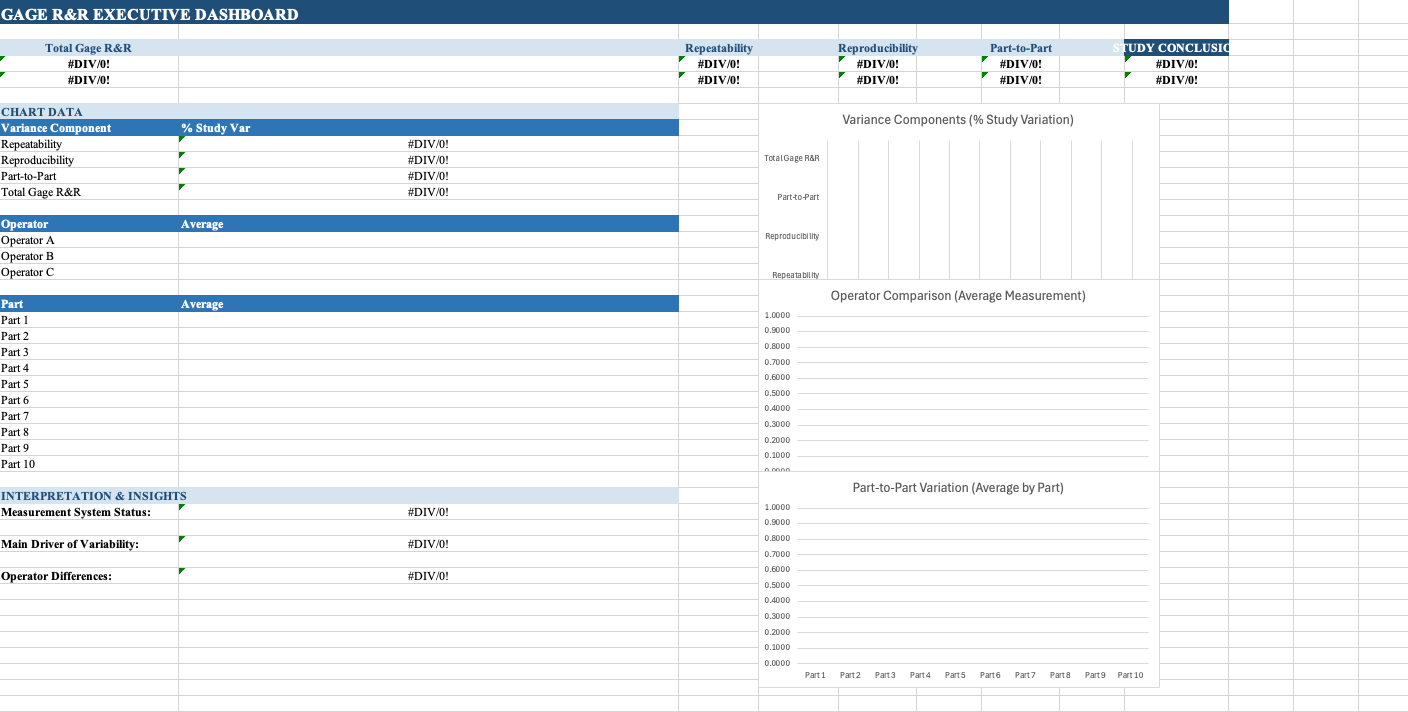
A measurement system validation tool using Gage R&R methodology to quantify repeatability and reproducibility across operators and conditions. ANOVA-based analysis, automated variance calculations, and visual dashboards assess measurement reliability — identifying whether variability stems from the process or the measurement system itself.
- ANOVA-based variance decomposition across repeatability and reproducibility
- Operator and part-to-part comparison charts auto-generated
- Study conclusion logic classifies measurement system as acceptable or not
- Supports 3 operators and up to 10 parts per study
Questions about these models?
Reach out if you'd like to discuss how these tools were built or want to collaborate on a custom financial model.